2023-03-20
This is Maëlle's DBGI daily open-notebook.
Today is 2023.03.20
TODO
- Check discussion: https://github.com/orgs/digital-botanical-gardens-initiative/discussions
- Check Zulip
CODE
NOTES
GNPS Dashboard: collaborative exploration of mass spectrometry data in the web browser
Petras, D., Phelan, V.V., Acharya, D. et al. GNPS Dashboard: collaborative exploration of mass spectrometry data in the web browser. Nat Methods 19, 134–136 (2022). https://doi.org/10.1038/s41592-021-01339-5
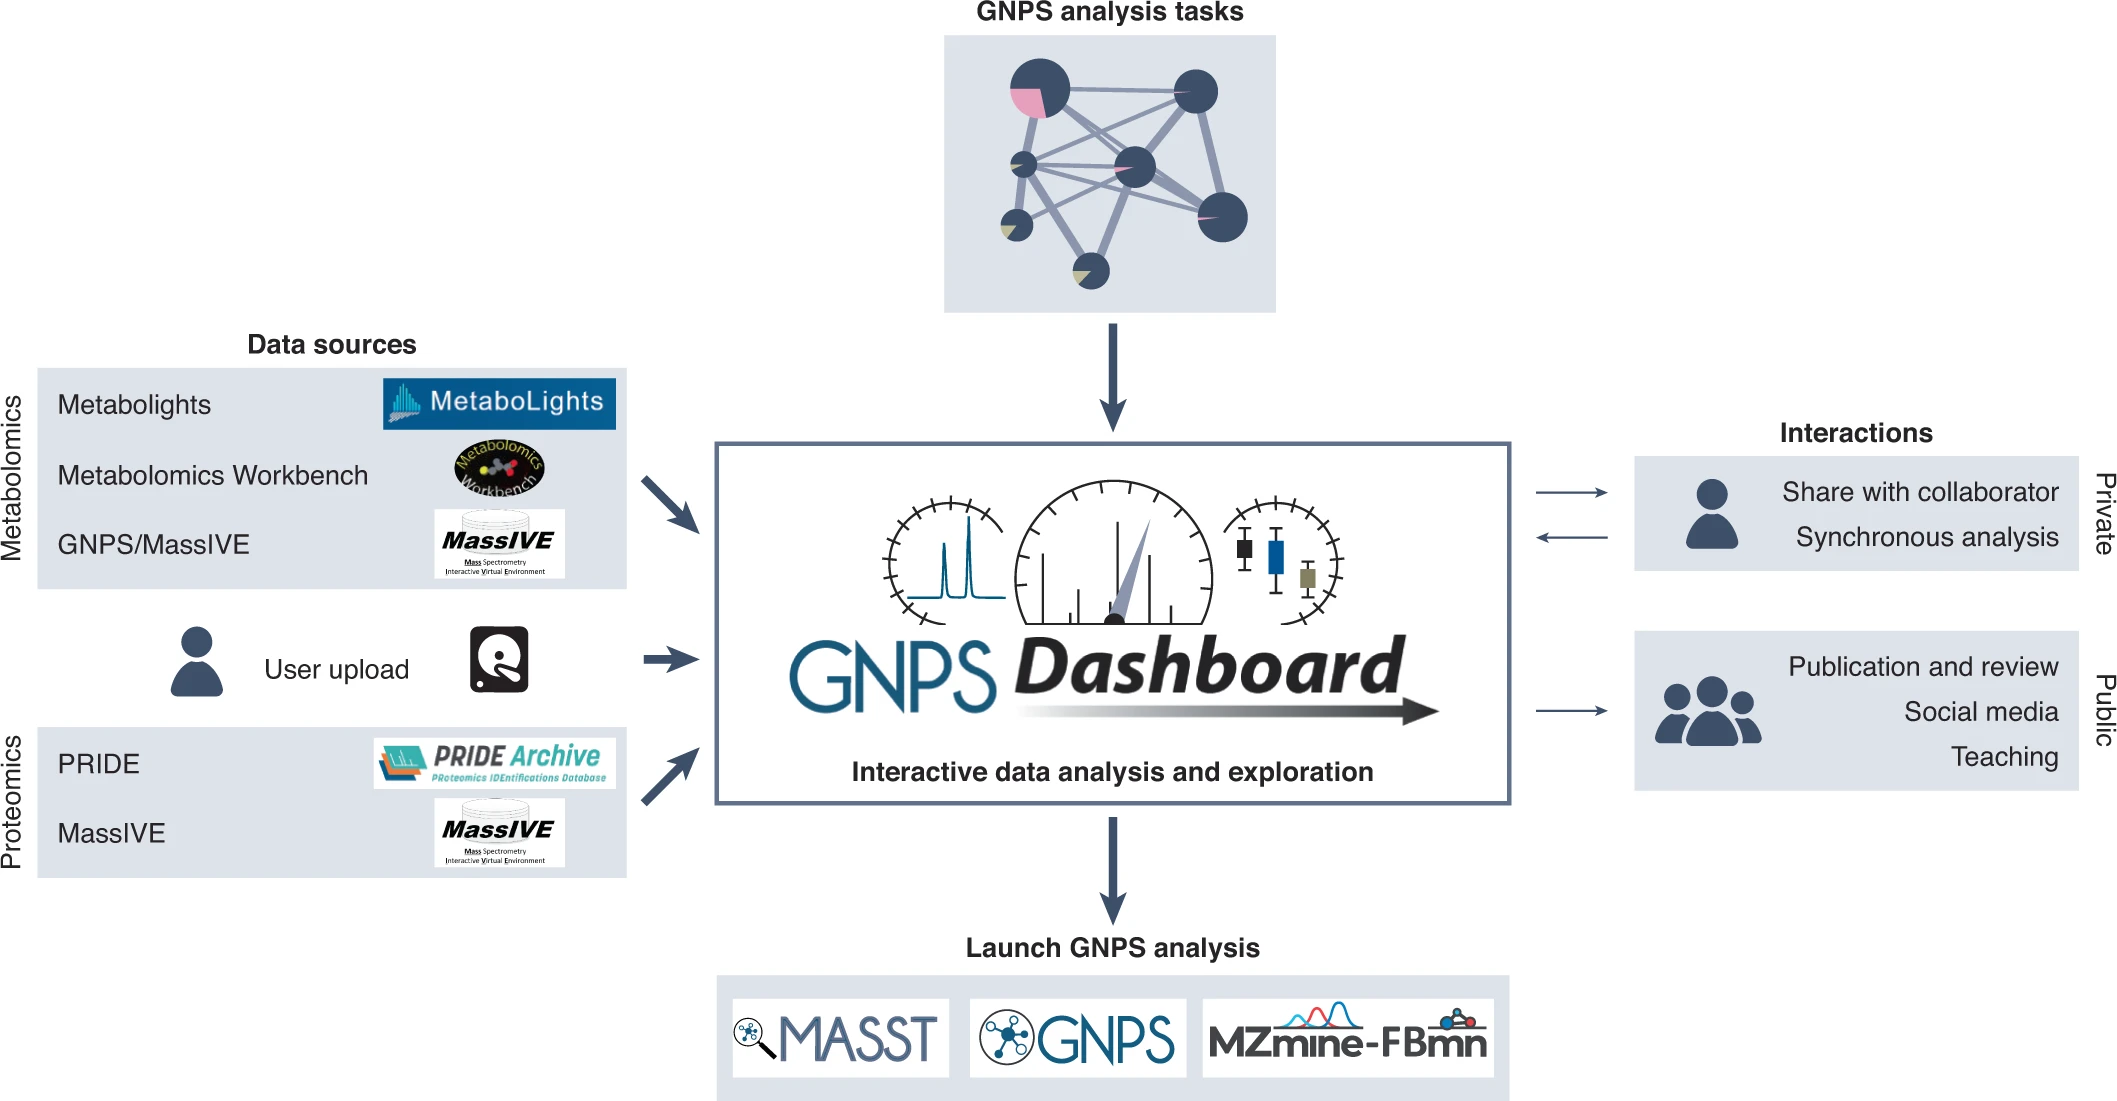
=> Developped to provide open and transparent solutions to use, share, inspect and reproduce mass spectrometry data analysis.
- Enable remote and synchronous collaborative research in a common analysis environment for MS data analysis (same idea as Google Docs for example)
- Includes leader-follower synchronization (real-time updates from one lead user) and fully collaborative synchronization (real-time updates from multiple users)
- Followers can disconnect the synchronization to continue the analysis from where the leader left off
- Makes spectrometry data adherent to FAIR (findable, accessible, interoperable and reusable)
- Final state of the analysis is saved together with every discrete action, enabling inspection of the evolution of data analysis
Data:
- All public data from compatible repositories can be selected using the GNPS dataset explorer
- Files not deposited in public MS repositories can be uploaded through a drag-and drop option for file transfer
Visualization:
- enables inspection of
- total ion chromatograms,
- retention time versus m/z heat map,
- extracted ion chromatograms,
- tandem mass spectra for inspection/visualization of individual compounds
- and quantitative comparison of the peak abundances of two groups as boxplots
- all with publication-quality figures
Sharability:
- shareable URL and QR code(for final visualization)
- empowers users to share the exact same visualization with colleagues, thus reducing miscommunication and improving data transparency
To sum up:
Help improve MS data acccessibility and interoperability, lower barriers of entry for MS data analysis in the research environment and the classroom, encourage data transparency and sharing, and strengten the reproducibility of MS data analysis.
TODO NEXT
- add progress bar https://dash.plotly.com/long-callbacks